


 38 / 146

22
(see “Item 7, Management’s Discussion and Analysis of Financial Condition and Results of Operations – Capital
Resources”).
(d) Securities Authorized for Issuance under Equity Compensation Plans
The following table provides information as of December 31, 2015 with respect to options outstanding and available
under our 2007 Stock Incentive Plan and the terminated 1998 Stock Option Plan, which are our only equity
compensation plans other than an employee benefit plan meeting the qualification requirements of Section 401(a) of
the Internal Revenue Code:
Plan Category
Number of Securities
to be Issued Upon Exercise
of Outstanding Options
Weighted-Average
Exercise Price of
Outstanding Options
Number of Securities
Remaining Available
for Future Issuance
Equity compensation plans
approved by security holders
499,600
$14.83
808,980
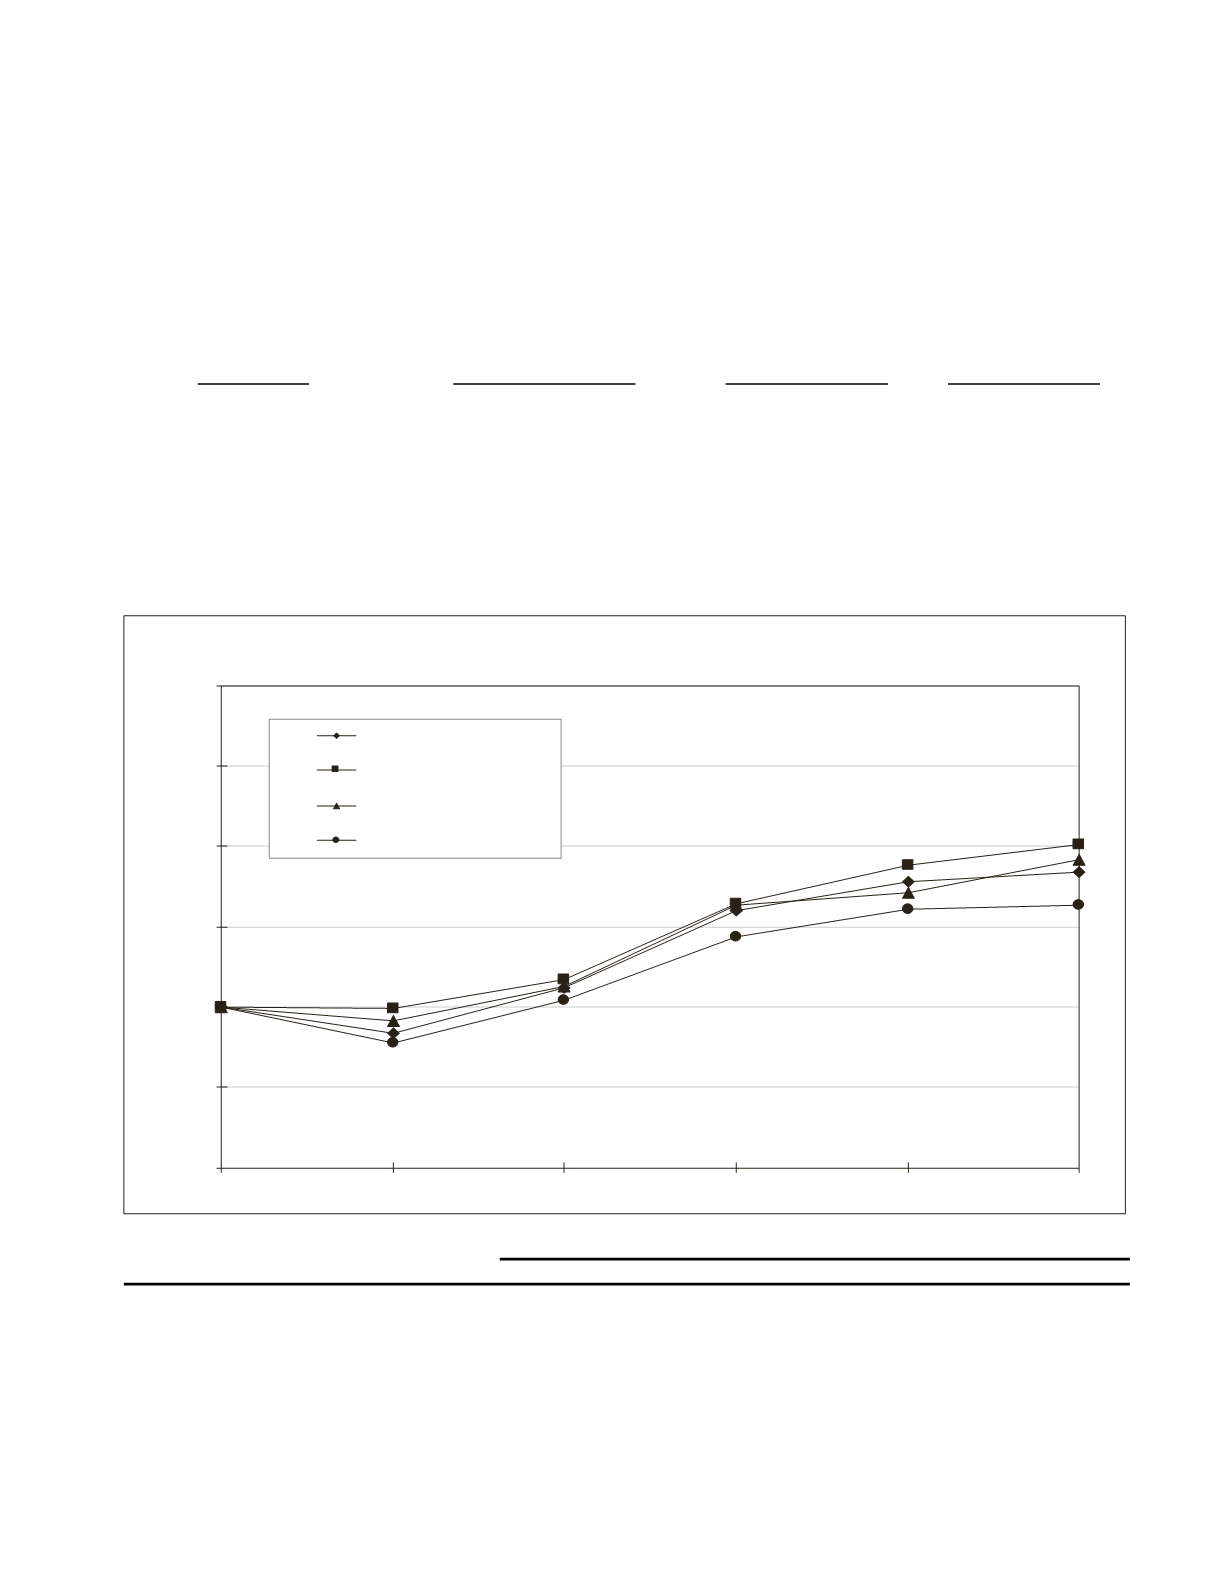
(e) Performance Graph
Below is a five-year performance graph comparing the cumulative total return on the Company’s common stock to
the cumulative total returns of the NASDAQ Composite Index (a broad equity market index), the SNL Bank Index,
and the SNL $1 billion to $5 billion Bank Index (the latter two qualifying as peer bank indices), assuming a $100
investment on December 31, 2010 and the reinvestment of dividends.
Period Ending
Index
12/31/10 12/31/11 12/31/12 12/31/13 12/31/14 12/31/15
Sierra Bancorp
100.00
83.86 111.58 159.85 178.12 183.69
NASDAQ Composite
100.00
99.21 116.82 163.75 188.03 201.40
SNL Bank $1B-$5B
100.00
91.20 112.45 163.52 170.98 191.39
SNL Bank
100.00
77.44 104.51 143.49 160.40 163.14
0
50
100
150
200
250
300
12/31/10
12/31/11
12/31/12
12/31/13
12/31/14
12/31/15
Index Value
Total Return Performance
Sierra Bancorp
NASDAQ Composite
SNL Bank $1B-$5B
SNL Bank
Source: SNL Financial LC, Charlottesville, VA